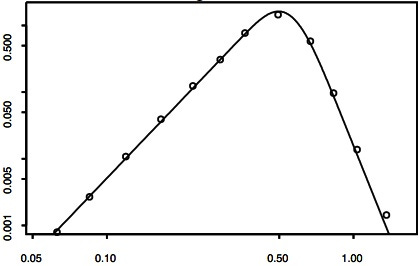
Here is a distribution of aeolian sand grain sizes:

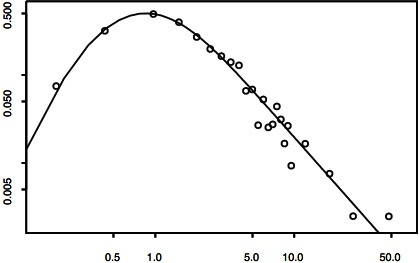
Here is a distribution of diamond sizes:

On a log-log scale like these, a power law is a straight line, while a lognormal distribution is a downward facing parabola. These distributions look like a lognormal in the middle with power law tails on either side.
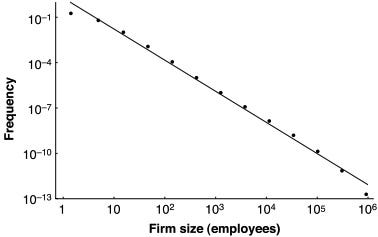
Important social variables are distributed similarly, including the (people) size of firms:

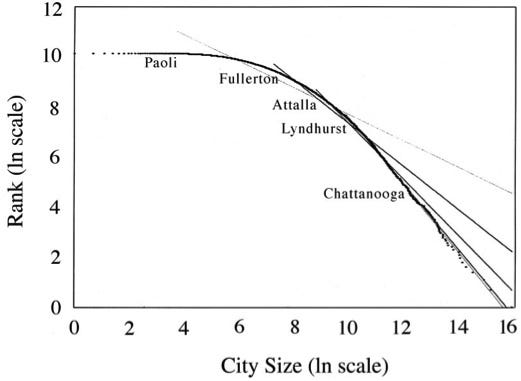
and of cities:

In these two cases the upper tail follows Zipf’s law, with a slope very close to one, implying that each factor of two in size contains the same number of people. That is, there are just as many people in all the cities with 100,000 to 200,000 people as there are in all the cities with one million to two million people. (Since there are an infinite number of such ranges, this adds up to an infinite expected number of people in huge cities, but actual samples are finite.)
The double Pareto lognormal distribution models this via an exponential distribution over lognormal lifetimes. In a simple diffusion process, positions that start out concentrated at a point spread out into a normal distribution whose variance increases steadily with time. With a normal distribution over the point where this process started, and a constant chance in time of ending it, the distribution over ending positions is normal in the middle, but has fat exponential tails. And via a log transform, this becomes a lognormal with power-law tails.
This makes sense as a model of sizes for particles, firms, and cities when such things have widely (e.g., exponentially) varying lifetimes. Random collisions between grains chip off pieces, giving both a fluctuating drift in particle size and an exponential distribution of grain ages (since starting as a chip). Firms and cities also tend to start and die at somewhat constant rates, and to drift randomly in size.
In the math, a Zipf upper tail, with a power of near one, implies little local net growth of each item, so that size drift nearly counters birth and death rates. For example, if a typical thousand-person firm grows by 1% per year (with half growing slower and half growing faster than 1%), but has a 1% chance each year of dying (assuming no firms start at that size), it will keep the same expected number of employees. Such a firm has no local net growth.
Interestingly, individual wealth is distributed similarly. More on that in my next post.


@KhothI was a little bit too fast with my praise of the eeckhout paper (cities).
If you take a closer look at the whole thing, there are more than 20 % of the population missing in the plot. Most (european) countries do not accept "cities" with less than 2 - 5000 people, cutting off the left 2/3 of the data points, or half the ln size distribution. On the right side, as the paper states, he takes the smaller US size definition, putting LA at 3.7 Mio, instead of 16 Mio with the definition closer to european views, and strong deviation from a log normal or Zipf distribution. That leaves than the transition region for fitting, and you can do this in many ways. You can even find on the homepage of the author some comment exchange in 2009 with Levy on this. Beyond that, if you look up data on "urbanization", (e.g. CIA, wiki) you will find that over 50 % of the differences are due to different definitions of "city" (see German wiki "Stadt": DK: 200; JP 50 000)
bottomline: if you want, you can fit the log normal distribution, but many others as well, and it doesn't prove anything about underlying mechanisms.Very typical results for economics / sociology.
Hah, I thought the firm size graph looked suspiciously neat. I hadn't noticed that the scale on the y-axis was impossible. Nice catch.