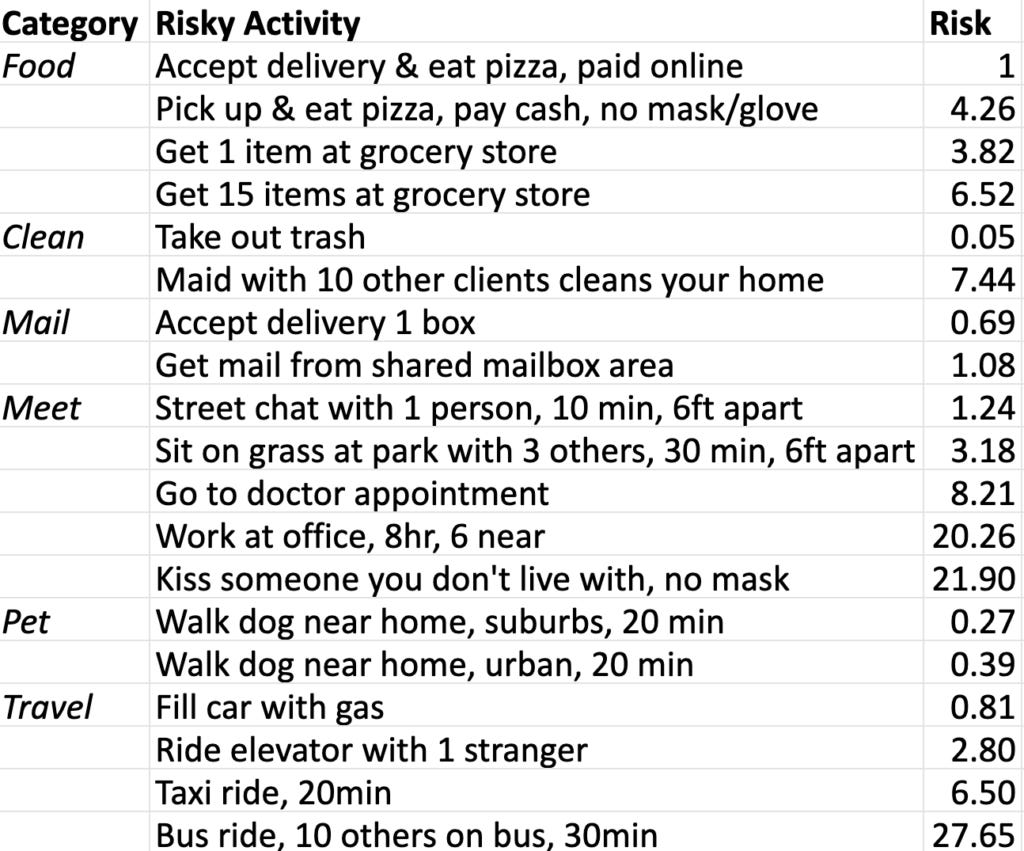
To keep us from catching and spreading Covid19, most of us are on “lockdown”, limiting non-home contact. But we aren’t completely isolated; we all do a few things that risk outside contact. And households really are the better unit of risk here; if one of you gets sick, the rest face a much higher risk.
To help households estimate and manage risk, I’ve made the following table, listing risks for 19 activities, all relative to the first: accepting delivery of and eating a pizza, paid for online. These risk estimates came from ~1000 respondents to each of 18 Twitter polls. (Technically, these estimates are medians of lognormal distributions fitted to poll response frequencies.) Yes, it would be better to get expert estimates, but I don’t have experts to poll. I hope experts who see these will publicly improve on them. Until they tell us more, we must act on what we know.

The above is actually part of a screenshot from this spreadsheet (copy it to edit it) that I’ve made to help you estimate household risk. (Anyone know how to embed it here, so each reader can edit their own version here?) On this sheet, you can combine these risk estimates with estimates of how often per week your household does each activity, and also any corrections for how you do it differently, to get your total household weekly “Pizza Risk”. That is, how many weekly risks you take equivalent to a pizza delivered & eaten.
In the spreadsheet, each row lists a risky activity, grouped into types. To use the sheet, consider the activity in each row and think of similar activities you do that risk outside contact. For each such activity, find the closest activity in the table, and for that row, enter how many times per week your household does that activity in the “Count” column. And if your activity seems to have a different risk from other households, such as because you do it for more or less time, or because it involves fewer or more outsiders, then enter a number other than 1 in the “Factor” column. For example, if doing it your way has twice the risk, enter the number 2.
If you mange to use this spreadsheet to get a Pizza Risk estimate, please complete the following two polls so we can learn about how Pizza Risk varies across households.
What Category of Risk was largest for you?
— Robin Hanson (@robinhanson) April 12, 2020
FYI, this post was up just 33 hours after I first tweeted the idea for this project.
Added 14Apr: Commentor Roman Kuksin did an explicit analysis of many of these risks, and finds a 0.74 correlation with the above risk estimates.
Added 18Apr: Here is another set of activity risk estimates: HT @diviacaroline.


Hmm that's a lot of scenarios, I'll have to find the time! But I'm interested in stress-testing my model as well + vetting it for extensibility with the multiple scenarios. I'll get back to you soon.
Can you use your estimator on the risks I rated, so we can see how strongly our estimations correlate?